IEEE39 Gridspace soil-resistivity study
This example reuses the NetworkBuilder model exercised by the IEEE39 parity tests and applies one shared soil-resistivity grid to every overhead line and cable. Driving-point harmonic impedances at three representative buses are overlaid for direct comparison.
using CairoMakie
using GraphMakie
using PowerImpedance
using PowerImpedance.NetworkBuilder: Grid, Gridspace, NetworkState, define
The parity fixture is the authoritative NetworkBuilder version of this system. Skip its top-level testsets while retaining its model functions and constants. This keeps the example synchronized with the parity test rather than maintaining a second thousand-line copy of the system.
function include_ieee39_networkbuilder_fixture()
    isdefined(@__MODULE__, :ieee39bus_elements) && return nothing

    skip_testsets(expression) =
        if expression isa Expr &&
           expression.head === :macrocall &&
           expression.args[1] === Symbol("@testset")
            :(nothing)
        else
            expression
        end

    path = joinpath(pkgdir(PowerImpedance), "test", "NetworkBuilder_test.jl")
    Base.include(skip_testsets, @__MODULE__, path)
    return nothing
end;

include_ieee39_networkbuilder_fixture();
The requested input repeats 1000 Ωm. Duplicate values produce identical solves and curves, so the grid retains its three unique physical cases.
const IEEE39_REQUESTED_SOIL_RESISTIVITY = (10.0, 100.0, 1000.0, 1000.0)
const IEEE39_SOIL_RESISTIVITY = Tuple(unique(IEEE39_REQUESTED_SOIL_RESISTIVITY))
const IEEE39_REPRESENTATIVE_BUSES = (9, 16, 29)

const IEEE39_BUILDER_OPTIONS = (;
    voltageBase = Vm1,
    power_flow = (; is_bounded = (; bus_voltage = true))
);
Inspect the network topology
NetworkDiagramDefinition projects the materialized network directly; it does not run power flow or repeat a conversion. The Cairo backend renders the same PlotBuilder recipe used by the interactive GL and WGL backends. Its automatic figure size follows the portrait-oriented IEEE39 layout while the reset and SVG-export controls remain visible.
function plot_ieee39_network_diagram(network)
    return only(PowerImpedance.plot(
        network;
        backend = :cairo,
        display_plot = false,
        interactive = false,
        title = "IEEE39 network diagram",
        export_theme = :publication,
        open_export = false
    ))
end;

ieee39_docs_network = define(
    ieee39bus_elements(),
    ieee39bus_connections();
    options = IEEE39_BUILDER_OPTIONS,
)
ieee39_docs_diagram = plot_ieee39_network_diagram(ieee39_docs_network)
ieee39_docs_diagram.figure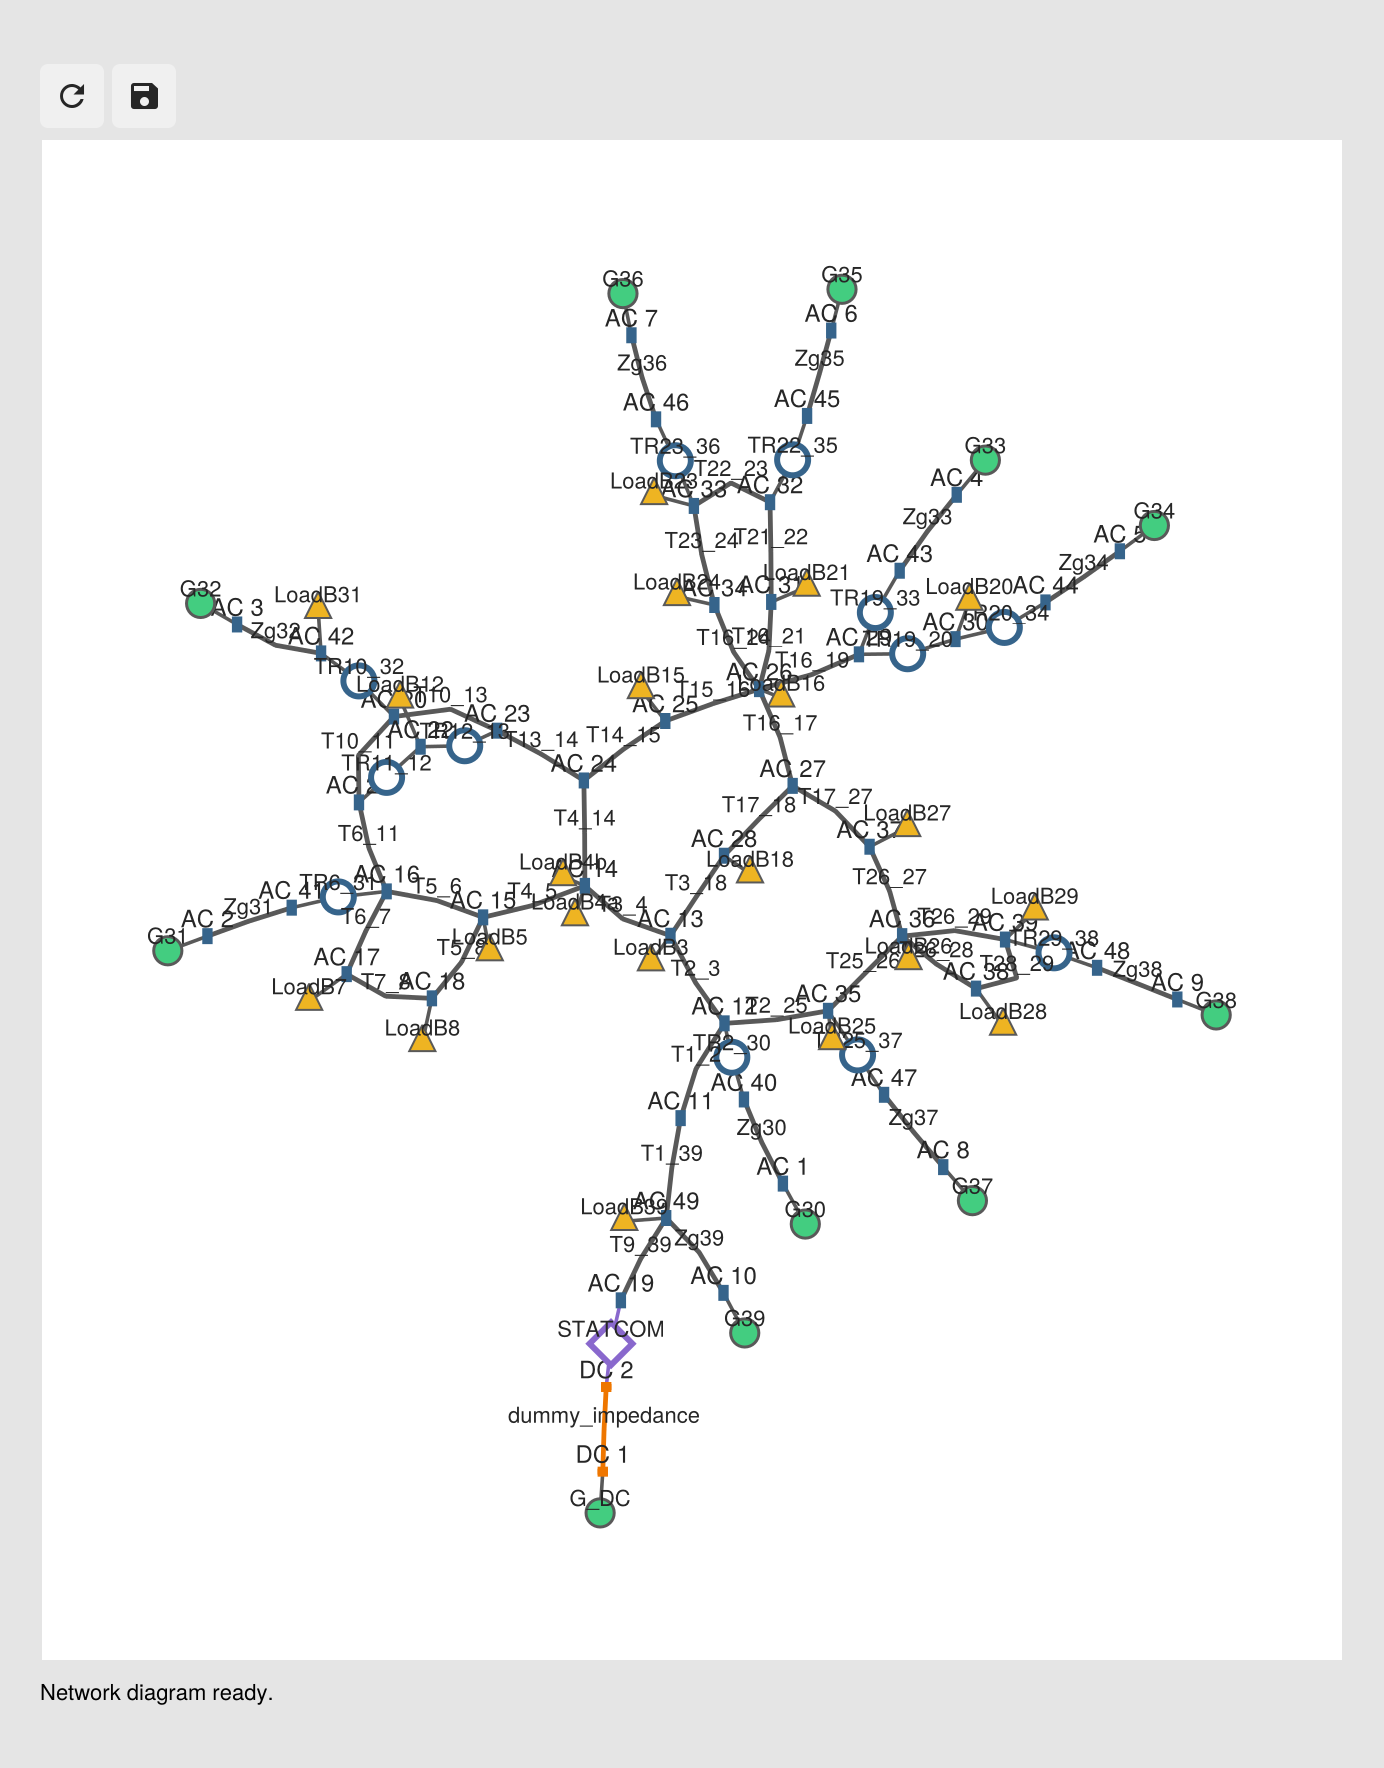
Apply one resistivity value everywhere
function element_at_soil_resistivity(element, soil_resistivity)
    model = element.element_model

    if model isa PowerImpedance.Overhead_line
        return overhead_line(
            length = model.length,
            conductors = deepcopy(model.conductors),
            groundwires = deepcopy(model.groundwires),
            earth_parameters = (
                model.earth_parameters[1],
                model.earth_parameters[2],
                soil_resistivity
            ),
            transformation = element.transformation,
            connection = element.connection
        )
    elseif model isa PowerImpedance.Cable
        conductors = NamedTuple{Tuple(keys(model.conductors))}(
            Tuple(deepcopy(value) for value in values(model.conductors)),
        )
        insulators = NamedTuple{Tuple(keys(model.insulators))}(
            Tuple(deepcopy(value) for value in values(model.insulators)),
        )
        return cable(;
            length = model.length,
            positions = deepcopy(model.positions),
            earth_parameters = (
                model.earth_parameters[1],
                model.earth_parameters[2],
                soil_resistivity
            ),
            configuration = model.configuration,
            type = model.type,
            eliminate = model.eliminate,
            transformation = element.transformation,
            connection = element.connection,
            conductors...,
            insulators...
        )
    end

    return deepcopy(element)
end;

function ieee39_elements_at_soil_resistivity(base_elements, soil_resistivity)
    names = keys(base_elements)
    elements = map(values(base_elements)) do element
        element_at_soil_resistivity(element, soil_resistivity)
    end
    return NamedTuple{names}(Tuple(elements))
end;
One Grid axis changes all line models together. The resulting coordinates identify each case as soil_resistivity = 10, 100, or 1000 Ωm.
function ieee39_soil_builder_space(
        soil_resistivities = IEEE39_SOIL_RESISTIVITY;
        base_elements = ieee39bus_elements()
)
    connections = ieee39bus_connections()
    function materialize(soil_resistivity)
        return define(
            ieee39_elements_at_soil_resistivity(base_elements, soil_resistivity),
            connections;
            options = IEEE39_BUILDER_OPTIONS
        )
    end

    return Gridspace{NetworkState}(
        materialize,
        (Grid(soil_resistivities),),
        (:soil_resistivity,)
    )
end;
Soil resistivity changes the passive frequency-domain models. Each case owns its power flow and linearization, which keeps calculation state out of the network definitions.
function ieee39_bus_nets(buses)
    return reduce(vcat, ([Symbol("Bus$(bus)d"), Symbol("Bus$(bus)q")] for bus in buses))
end;

function run_ieee39_soil_study(;
        soil_resistivities = IEEE39_SOIL_RESISTIVITY,
        buses = IEEE39_REPRESENTATIVE_BUSES,
        freq_range = (1.0, 5e3, 400)
)
    base_elements = ieee39bus_elements()
    networks = ieee39_soil_builder_space(soil_resistivities; base_elements)
    problems = PowerImpedanceProblem(
        networks;
        nodes=ieee39_bus_nets(buses),
        eliminated_elements=IEEE39_ELIM_ELEMENTS,
        frequency_range=freq_range,
    )
    result = compute(
        ParametricProblem(problems),
        Combinatorial(NodalImpedance()),
    )
    return (;
        soil_resistivities = collect(soil_resistivities), buses = collect(buses), result)
end;
Overlay the harmonic impedances
The d-axis diagonal entry is used as the driving-point impedance at each bus. maximum_spread_db quantifies whether soil resistivity visibly separates the curves and makes the sensitivity check reproducible. A reduced validation scan gave maximum separations of about 0.97 dB at Bus 9, 0.82 dB at Bus 16, and 1.08 dB at Bus 29, so soil resistivity remains a visible KPI and no fallback parameter scan is needed.
function ieee39_impedance_db(case, bus_index)
    net_index = 2bus_index - 1
    return 20 .* log10.(abs.(vec(case.response[net_index, net_index, :])))
end;

function maximum_spread_db(study, bus_index)
    curves = hcat((ieee39_impedance_db(case, bus_index) for case in study.result.values)...)
    return maximum(maximum(curves; dims = 2) .- minimum(curves; dims = 2))
end;

function plot_ieee39_soil_study(study)
    entries = [(2index - 1, 2index - 1) for index in eachindex(study.buses)]
    labels = ["ρsoil = $(value) Ωm" for value in study.soil_resistivities]
    groups = [Symbol("soil_", replace(string(value), "." => "_"))
              for value in study.soil_resistivities]
    handles = PowerImpedance.plot(
        study.result;
        entries,
        grouping=:panels,
        labels,
        series_groups=groups,
        title="IEEE39 harmonic impedance versus common soil resistivity",
        figure_size=(1150, 1050),
        display_plot=false,
        controls=false,
    )
    return only(handles)
end;
The documentation evaluates the same three physical cases with a reduced frequency grid. Running this source file directly uses the full defaults.
ieee39_docs_study = run_ieee39_soil_study(; freq_range = (1.0, 5e3, 160))
ieee39_docs_plot = plot_ieee39_soil_study(ieee39_docs_study)
ieee39_docs_plot.figure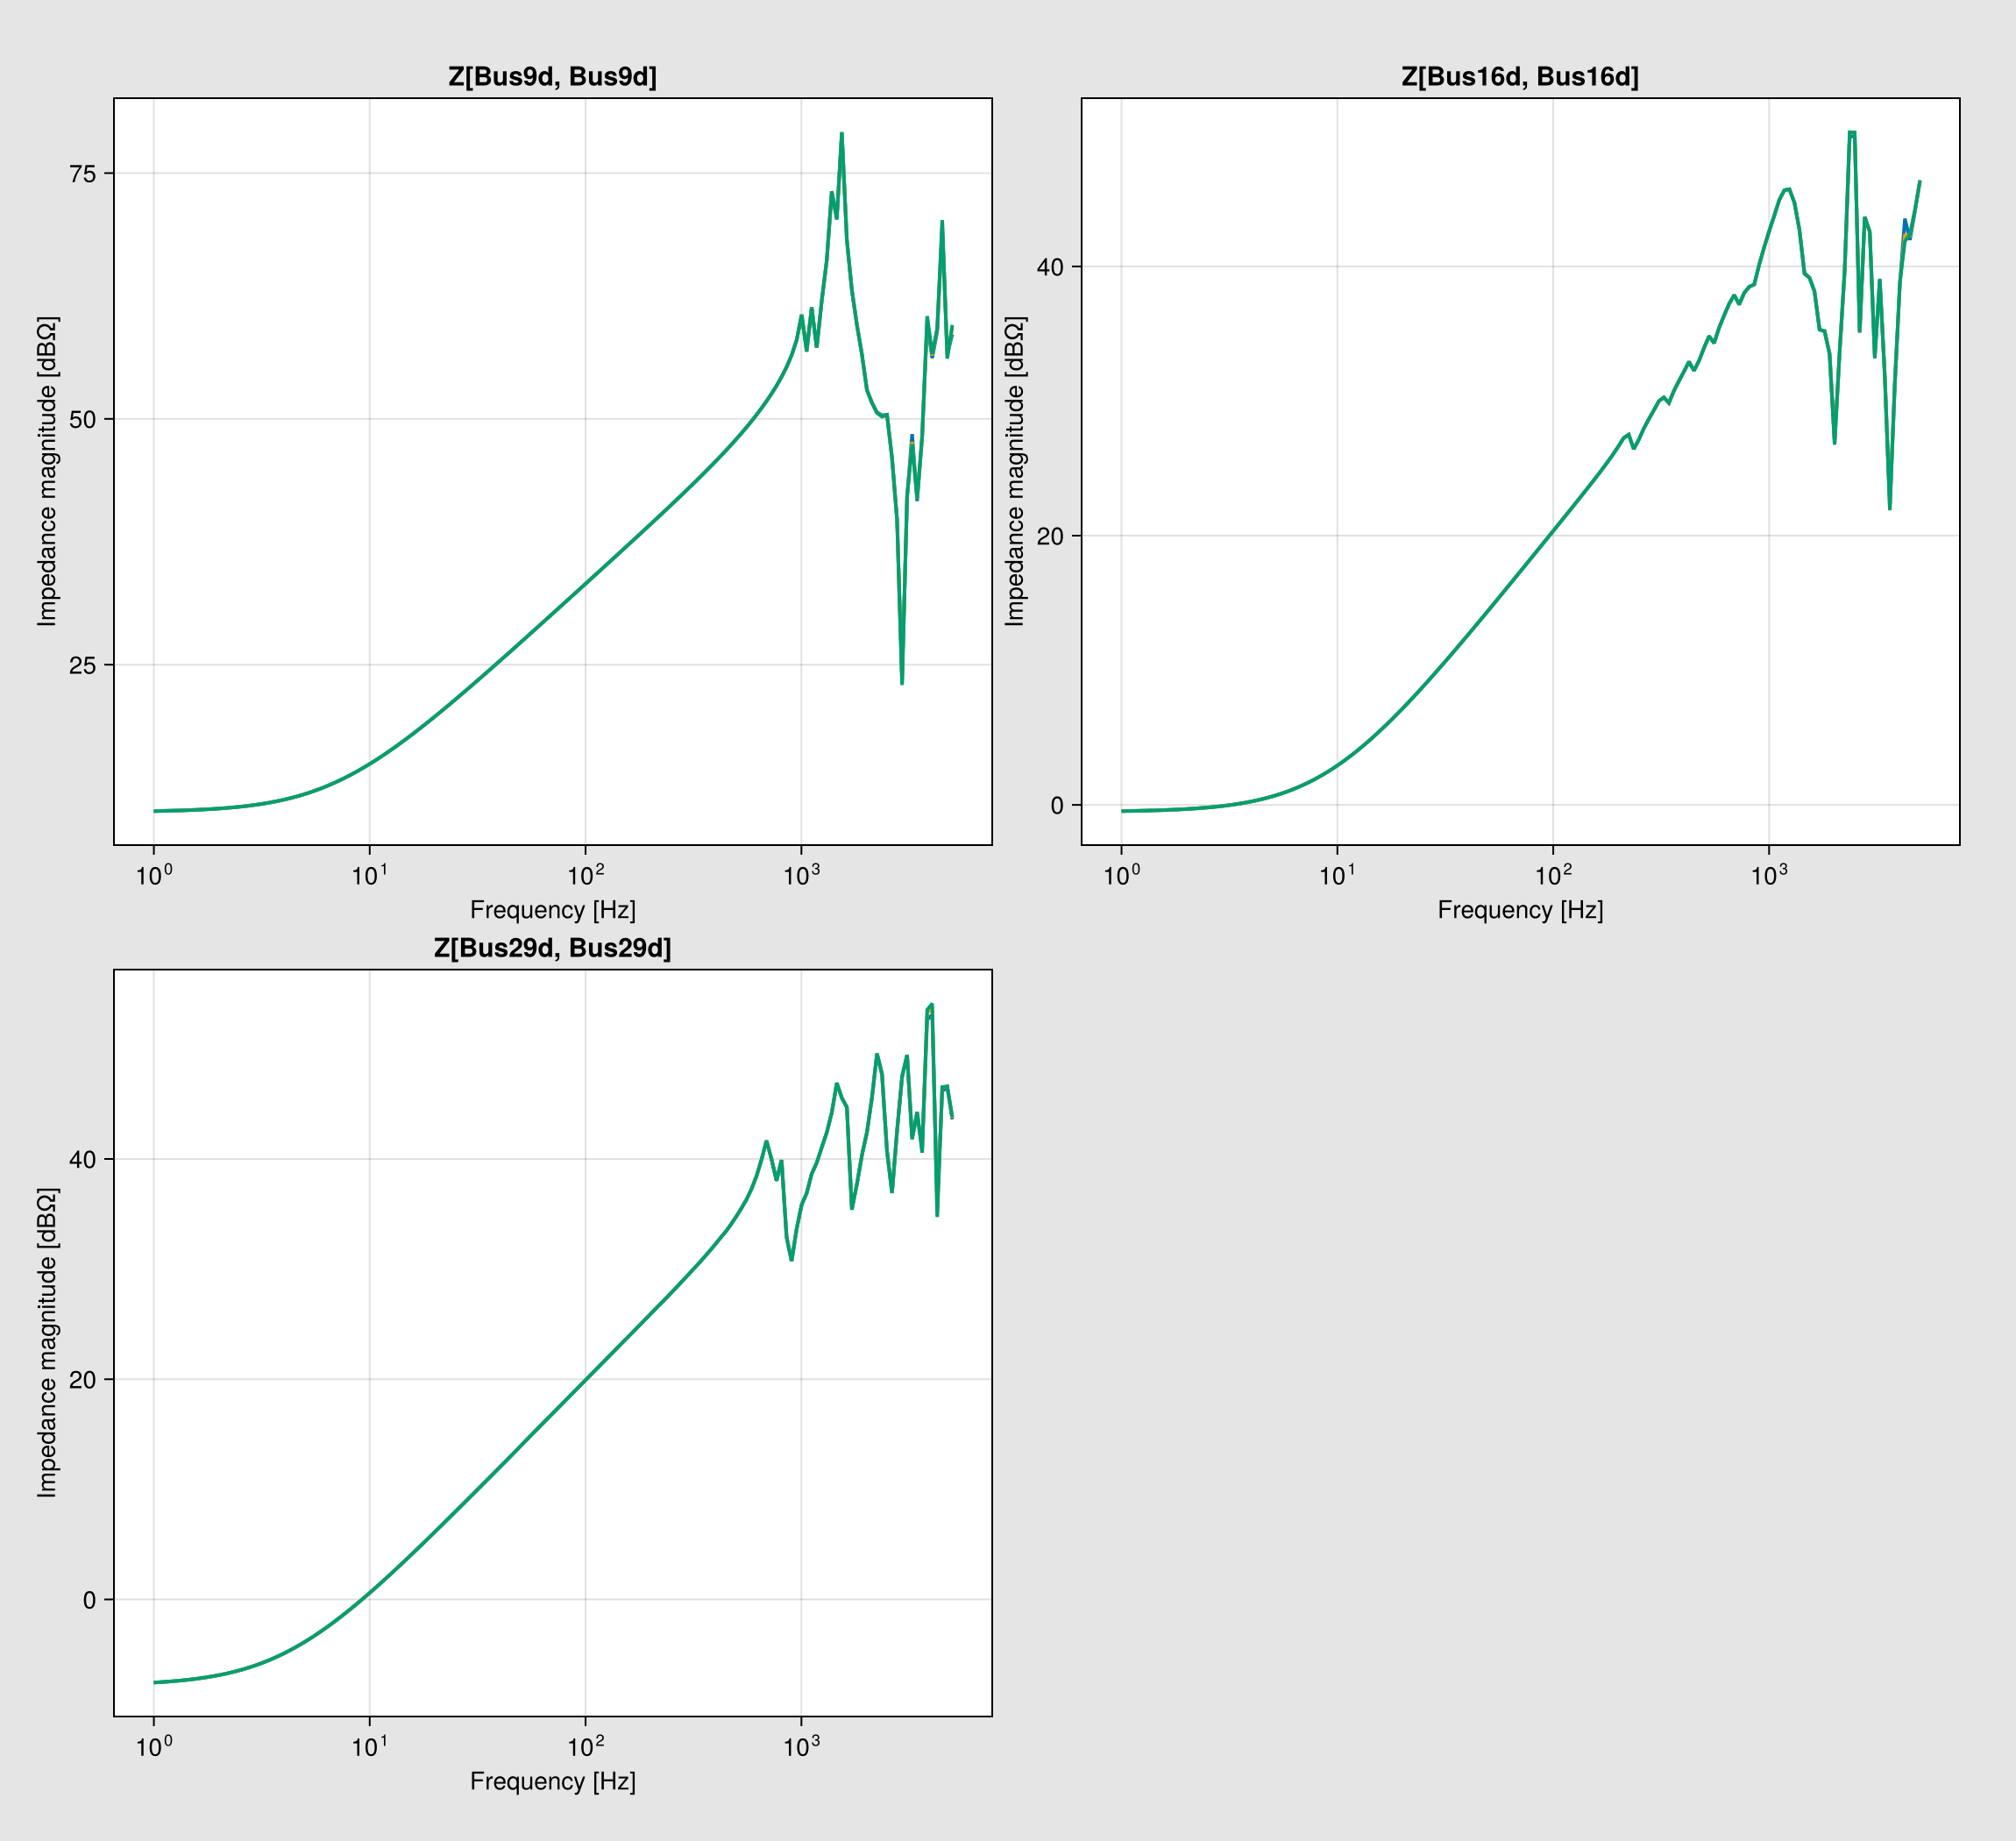
Back to Examples